Check out my first LIVE CASE STUDY and watch me build a 300,000+ page site! I show everything – domain, Google analytics, SEO strategy...

The Man Who Sold the Web Blog | Category Archive | Uncategorized


Archive | Uncategorized RSS feed for this section

Objectives and Key Results (OKR): Your Management Strategy to Achieving That Goal

3 Apr

Peter Drucker, one of the first managerial thinkers, introduced MBO or Management by Objectives. This eventually paved the way for the birth of the Objectives and Key Results (OKR) management philosophy. Andy Grove, known as the “Father of OKRs”, introduced the approach to Intel during the 1970s. This was further popularized by John Doer by introducing OKRs at Google in 1999.

Today, successful organizations are now using OKRs.  Objectives and Key Results is an efficient way to track company and team goals and measure their progress. It helps every organization’s success by cutting out unimportant goals and focusing on what truly is important within the organization.

Objectives and Key Results (OKR) has been seen as a way to communicate so that there is clarity of purpose.  It is also a tool for motivating and aligning people to work together to achieve Operational Excellence. It increases transparency, accountability, and empowerment.

What is OKR?

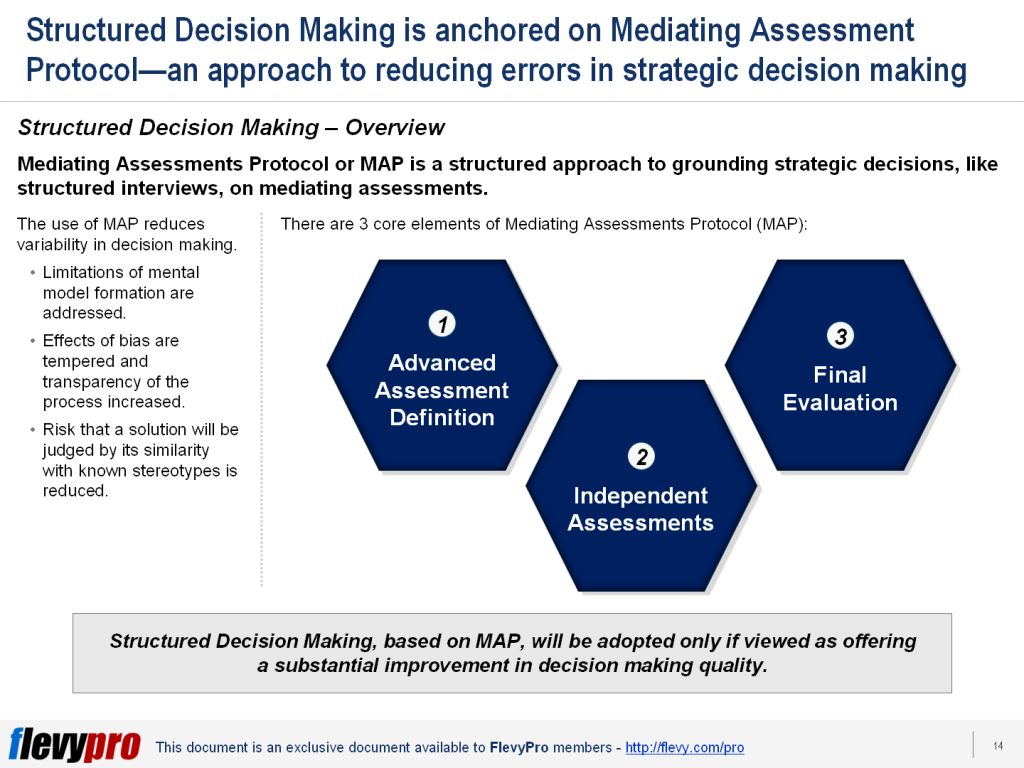
OKR or Objectives and Key Results is a popular Management Strategy for goal setting within organizations.  The goal of OKR is to define how to achieve objectives through concrete, specific, and measurable actions.

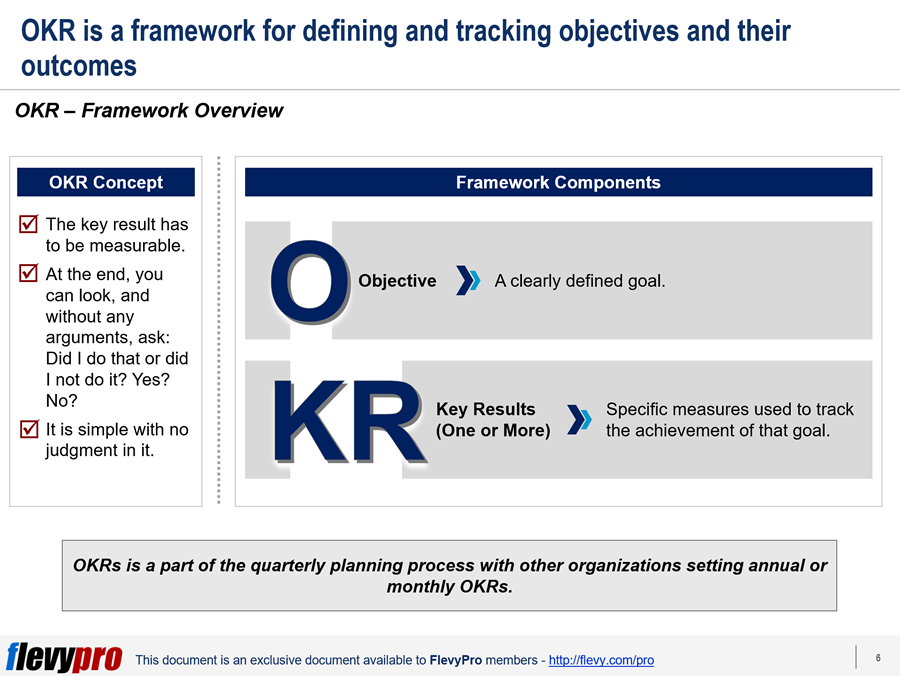
The OKR framework is structured with two framework components: the Objectives and Key Results. This is to connect company, team, and personal goals to measurable results and direct all towards one unified direction

  1. Objectives. The Objectives consist of a list of 3-5 high-level objectives. This is supported by initiatives—plans and activities focused on achieving the objective and moving forward the key results. Setting objectives requires a lot of thought as it goes beyond making money. In fact, it must follow defined characteristics and undertaken in a well-planned approach.  This is to ensure that the objectives formulated are well-defined, focused, and achievable.
  2. Key Results. Key Results add metrics to objectives. These are measured on a 0-100% scale or 0 to 1.0. Under each objective are 3 to 5 measurable Key Results. It measures how far from the objective your team is. It will give them a clear direction on what to do and how to do it.

Developing the right OKR requires being able to properly define your Objectives and Key Results. One way of doing this is by using the SMART goal setting model.

A Look at the SMART Model

The SMART Model ensures that organizations get to effectively develop the right OKR.  The SMART Model is the easiest way to set Key Results. Organizations just need to follow the SMART goal guidelines. Knowing what to do, as well as knowing not what to do, on an OKR journey to minimize problems and mistakes.

The use of OKR requires cultural change and change itself is difficult. But with the use of the SMART goal guidelines, organizations can get the hang of it and can be effective in its OKR journey.

Let us take a look at OKR examples that provides a clear application of the SMART model.

The first example is the use of Sales OKR. Set Objective is to increase Q2 recurring revenues. Key Results are increased average subscription size by $500 per month ($0-$1500). The second Key Result is to increase the share of monthly subscription vs. one-time contracts sold to 85% (50%-85%).

Another example is the Human Resource OKR. Set Objective is to improve internal employee engagement. Its first Key Result is conduct a monthly “Fun Friday” all-hands meetings with an external motivational speaker (0-3 meetings).

Interested in gaining more understanding of Objectives and Key Results? You can learn more and download an editable PowerPoint about Objectives and Key Results (OKR) here on the Flevy documents marketplace.

Are you a management consultant?

You can download this and hundreds of other consulting frameworks and consulting training guides from the FlevyPro library.

Digital Supply Chain Strategy: How to Counter Potential Disruptions in Today’s Digital Age

1 Apr

In today’s digital age, organizations are faced with the changing nature of the demand curve and the element of uncertainty in the supply chain. For operations teams, the challenge and competitive advantage have become: How well do you respond and execute against ongoing uncertainty.

With the world being so unpredictable, chaos is now the new normal. Timetables and priorities have shifted. A supplier fails to deliver. Demands on supply chains are increasing exponentially. A few years ago, supply chain performance was all about batch quantities, timetables, and lead times. Today, millions of packages are shipped in a day, with many with just only a few items.

In the face of this upheaval, supply chains try to predict what will happen, then optimize performance against plan. Most often, those plans are not met. The path forward demands a bold leap in supply chain performance.

Business in the Midst of the Digital Age.

Chaos is the new normal. This is the central challenge companies have to contend with today. Demand on the Supply Chain is increasing exponentially whereas Supply Chain performance before used to be all about batch quantities, timetables, and lead times. Today, times have changed.

Business Transformation has become pertinent. Timetables and priorities have shifted and, in fact, suppliers are now finding themselves unable to deliver at the required time demanded by the market. Whereas before deliveries were in batch quantities, today millions of packages are shipped every day with many having just a few items. Customers are now encouraged to order multiple sizes and colors of the same items, choose what they like best and return the rest.

In this upheaval, Supply Chains must respond accordingly. There have been attempts to predict what will happen with performance being optimized against the plan. Companies are increasingly investing in Supply Chain capabilities. Yet, these have triggered nonproductive finger-pointing and disappointing results.

Something is missing. A Supply Chain Strategy, as part of Strategy Development, is now essential to be able to pursue a bold leap in Supply Chain performance.

The Digital Supply Chain Strategy

The Digital Supply Chain Strategy is the new approach to Supply Chain resilience. This is best undertaken using a 2-prong approach.

  1.  Sense and Pivot. A Supply Chain Strategy, Sense and Pivot focuses on building adaptability of Supply Chains. When this is undertaken, it will allow organizations to create greater flexibility across the Supply Chains. New processes, governance, and ways of working will be developed that will leverage technological capabilities being advanced. Significantly, it will make planning, manufacturing, distribution, and logistics more adaptive toward demand volatility, customer expectations for personalization, and an increasingly unpredictable operation environment.
  2. Digitize and Automate. Digitize and Automate is another Digital Supply Chain Strategy that is focused on building the capability of the Supply Chain to execute against the plan. When this is undertaken and effectively executed and implemented, organizations can expect a better informed, more frictionless, more cost-efficient, and capable Supply Chain. Further, it will enable organizations to undertake more informed Strategic Planning as more accurate forecasts are achieved.

The Digital Age calls for a new approach to Supply Chain Resilience.

The Importance of Supply Chain Resilience

Why is Supply Chain Resilience important today? In today’s digital age, companies can expect to encounter potential disruptions. These potential disruptions can effectively be addressed using the best strategy. Automation and smart software are effective tools for minimizing disruptions on business operations. Embracing digital advancements will provide organizations real-time data for a more reliable supply value chain. Definitely, there will be integration challenges. But the use of Digital Age Supply Chain Strategies will guide companies to counter these potential disruptions and challenges.

Interested in gaining more understanding of Digital Supply Chain Strategy? You can learn more and download an editable PowerPoint about Digital Supply Chain Strategy here on the Flevy documents marketplace.

Are you a management consultant?

You can download this and hundreds of other consulting frameworks and consulting training guides from the FlevyPro library.

Board Excellence 101: Your Guide to Building A Forward-looking Board

30 Mar

The amount of time the Board of Directors spend on their work and commit to strategy is rising. Directors say they dedicate more time now to their Board duties than ever before.  In fact, since 2011, the directors have cut in half the gap between the actual and ideal amount of time they spend on Board work.

In the newest McKinsey Global Survey on Corporate Boards, the results showed that strategy, on average, is the main focus of many Boards.  Yet, directors still want more time for strategy when they consider their relative value to their companies.  This is more than any other area of the Board work.

The Evolving Trends Influencing Board Work

In recent years, the amount of time the Board of Directors spends on Board work has increased.  Compared to 2011, directors now spend five more days per year on Board work. Another trend that is happening is the increase in time. As the number of days has grown, so has the amount of time spent on strategy.

Based on the survey, a total of 772 days was spent on Board work in 2013.  This has increased to 1,074 in 2015. Subsequently, 8.91% was spent on strategy in 2015 compared to 7.85% in 2013. With an increased focus on strategy, directors are dedicating more time on Strategic Planning and to discuss strategic issues.

In the next three years, directors would like to dedicate more time to Strategy Development and on organizational health and talent management. Directors want to increase the time spent on strategy due to its relative value to their companies.

The 3 Types of Boards

Performance of Boards based on overall impact, performance, and operation showed that there are 3 types of Boards.

  1. Ineffective. Ineffective Boards report the lowest overall impact and non-performance of tasks. They have the lowest overall impact on long-term value creation. Ineffective Boards are least effective at the 37 tasks required of the Board and they do not execute some of the tasks at all. Only a few are found to be effective at any one task.
  2. Complacent. Complacent Boards have a much more favorable view of their over-all contributions. Half of the directors considered their Board having a very high impact on long-term value creation. Complacent Boards have been found to be effective in the performance of tasks on management review of financial performance, setting the company’s overall strategic performance, and formally approving the management team’s strategy.
  3. Excellent. Excellent Boards are the most well-rounded of the 3 types of Board of Directors. Their overall impact is very high. Significantly, they project greater effectiveness in the performance of tasks than peers on every single task. Further, they are effective in strategy and performance management.

Achieving Board Excellence: What Does It Take

Those boards that reach Excellence are found to be effective at 30 of the 37 tasks undertaken by the Board. Compared to others, they stand out in the ways they operate. They have an especially strong culture and mechanism for feedback. They are more than twice as likely to conduct regular evaluations and ask for input after each meeting.

While this may sound daunting, achieving a value-creating Board is achievable. There are just fundamental principles that the Board needs to follow to achieve Board Excellence. One of these guiding principles is spending more time.  Across-the-board increases are often achieved with more time spend on Board work.

Interested in gaining more understanding of achieving Board Excellence? You can learn more and download an editable PowerPoint about Board Excellence here on the Flevy documents marketplace.

Are you a management consultant?

You can download this and hundreds of other consulting frameworks and consulting training guides from the FlevyPro library.

4 Organizational Design (OD) Elements Essential to Inculcate the Desired Behaviors Across the Organization

27 Mar

Inculcating productive workforce behaviors is of utmost significance in Business Transformation, successful Strategy Execution, and Performance Improvement.  However, making people embrace productive behaviors involves a concerted effort across the organization.

The realization of Transformation, Strategy, and Performance improvement goals can become a reality by developing a thorough understanding of the 4 components of Organizational Behavior.  These components act as powerful levers in shaping the desired behaviors in the workforce:

  1. Organizational Structure
  2. Roles and Responsibilities
  3. Individual Talent
  4. Organizational Enablers

These Organizational Design levers work effectively when combined and aligned.  Let’s discuss the first 2 levers in detail now.

Organizational Structure

Organizational Structure represents the management reporting lines that create the organization’s spans of control, layers, and number of resources.  Organizational Structure is a foundational driver to Organizational Design, which also has a strong positive bearing on promoting the behaviors critical to improve the overall performance of the enterprise.  This is owing to the power that a position exerts on the subordinates based on factors that are important for individuals—e.g., work, compensation, and career ladder.

The Organizational Structure indicates an enterprise’s priorities.  An organization is typically structured in accordance with its top most priority.  For instance, functional organizational structure is adopted by enterprises having functional excellence as a priority.  In present-day’s competitive markets, most organizations have to deal with several priorities at a given time, which could be conflicting.  However, this does not mean adding new structures on top of existing ones, thereby increasing unnecessary complexity.  Creating overly complex structures to manage multiple priorities results in red tape and delayed decisions.  All roles are interdependent, necessitating cooperation.  This means taking care of the needs of others—instead of just watching over personal priorities—and encouraging individual behaviors that boost the efficiency of groups to achieve collective objectives.

Roles & Responsibilities

Roles and responsibilities deal with tasks allocated to each position and individual.  Organizational Design depends heavily on redefining clearer and compelling roles and responsibilities—to avoid any duplication of efforts or creating adversaries among team members.  In a collaborative culture where cooperation is the mainstay of an organization, individuals should not only be aware of what is required of them, but also appreciate the responsibilities of their team members, the authorities their roles exercise, the skills required, and the metrics to measure success.

A methodical way to outline roles and responsibilities effectively—while minimizing complexity—that encourages cooperation and empowerment is through the “Role Chartering” technique.  The technique requires distinctly identifying all roles on the basis of 6 key factors:

  • Describing shared and individual accountabilities
  • Outlining indicators to track success
  • Specifying who has the right to decide what
  • Indicating the capabilities critical for roles
  • Assigning the leadership traits valuable for the roles
  • Charting the abilities required for accomplishing personal and team goals.

Interested in learning more about these components to Organizational Behavior?  You can download an editable PowerPoint on Organizational Behaviors here on the Flevy documents marketplace.

Are you a Management Consultant?

You can download this and hundreds of other consulting frameworks and consulting training guides from the FlevyPro library.

A Startling Fact about Analytics-driven Organizations

27 Mar

Enterprises invest in Analytics to improve Decision Making and outcomes across the business. This is from Product Strategy and Innovation to Supply Chain Management, Customer Experience, and Risk Management. Yet, many executives are not yet seeing the results of their Analytics initiatives and investments.

Every organization putting on investment in Analytics has experienced several stumbling blocks. This differentiates the leaders from the laggards. Analytics-driven Organizations have clearly established processes, practices, and organizational conditions to achieve Operational Excellence. Their commitment to Analytics is creating a major payoff from their investments and a competitive edge.

What It Takes to Be Analytics-driven

The Harvard Business Review Analytic Services conducted a survey of 744 business executives around the world and across a variety of industries. Their focus was on the performance gap between companies that have struggled to get a return on their Analytics investment and those that have effectively leveraged their investment.

The survey showed that Analytics-driven Organizations get sufficient return on investment in Analytics. In fact, they have been highly successful in gaining a return on Analytics investment. This is gainfully achieved as organizations use Analytics consistently in strategic decision making. Executives of Analytics-driven Organizations rely on Analytics insights when it contradicted their gut feel.

Essentially, Analytics-driven Organizations have reduced costs and risks, increased Productivity, Revenue, and Innovation, and have successfully executed their Strategy. Yet, in evolving the organization’s Analytics approach, there can be 4 core obstacles that can affect their drive to getting a greater return on investment in Analytics.

The Core Obstacles to Finding Return on Analytics Investment

There are 4 core obstacles to being an Analytics-driven Organization.

Let’s briefly take a look at the first 2 obstacles:

  1. Communication and Decision-making Integration. The lack of Communication and Decision-making Integration limits the integration of Analytics into workflows and decision processes do not reach decision-makers. As a result of these core obstacles, the use of Analytics is limited in specific areas.
  2.  Skills to Interpret and Apply Analytics. A second core obstacle is the inadequate skills of business staff to interpret and use Analytics. In fact, the survey showed that only one-quarter of frontline employees use Analytics with only 7% using Analytics regularly.

The other two core obstacles are siloed and fragmented Analytics and time delay. These are two equally important core obstacles that can hinder the use of Analytics to maximize return on investment. Further, the 4 core obstacles are barriers to analytic success.

Are You Ready to Be an Analytics Leader?

Leaders use Analytics consistently in decision making. In fact, based on the survey, 83% of executives use it in business planning and forecasting. On the other hand, laggards only use it 67% of the time. Even in various aspects of the organization such as Marketing, Operations, Strategy Development, Sales, Supply Chain, Pricing and Revenue Management, and Information Technology, laggards use Analytics only half the time compared to Analytics Leaders.

Analytics Leaders always ensure that they establish the processes and organizational conditions to allow them to successfully deploy Analytics. In fact, to increase return on Analytics, organizations must undertake the use of four interrelated initiatives that will drive greater return on investment Analytics. These are four initiatives essential to building an Analytics-driven Organization.

One is building an organizational culture around Analytics. To achieve this the organization must have clear, strategic, and operational objectives that are set for Analytics. Second is deploying Analytics throughout all core functions of the business.

Starting with an Analytics-driven Culture can greatly facilitate cross-functional deployment of Analytics.

Interested in gaining more understanding of Analytics-driven Organization? You can learn more and download an editable PowerPoint about Analytics-driven Organization here on the Flevy documents marketplace.

Are you a management consultant?

You can download this and hundreds of other consulting frameworks and consulting training guides from the FlevyPro library.

Stop Making Unreliable Human Judgments: The Science of Strategic Decision Making

25 Mar

Human judgment can be unreliable as these are all susceptible to errors. In Strategy Development,  organizations make a lot of strategic decisions.  These strategic decisions share a common feature: they are evaluative judgments.

In making these tough calls, a large amount of complex information must be weighed down and evaluated.  While some management decisions are made without weighing quite so much information, yet strategic decisions involve the distillation of complexity into a single path forward.

With the unreliability in judgment, particularly in decision making, there is a need for a practical, broadly applicable approach to reducing errors. This approach is called the Mediating Assessments Protocol (MAP).

Why Human Judgment Can Be Unreliable

Human judgment can be unreliable as evaluations are susceptible to errors. These errors stem from known cognitive biases. There can be a tendency to give more weight to information that comes to mind easily because it is recent or striking than other more important facts.  We have the tendency to notice, believe, and recall information selectively which confirms our preexisting hypotheses and beliefs.

Making decisions can also be affected by the Mental Model we have formed. This is an impression of a complex situation that is often less nuanced and more coherent than the reality it represents. When decision making is influenced by biases, there will be errors in decision making.

The 3 Core Elements of MAP

MAP or Mediating Assessments Protocol is a structured approach to Strategic Decision Making. It consists of 3 core elements.

  1. Advanced Assessment Definition. The first core element requires the identification of mediating assessments. Mediating assessments are key attributes critical to the evaluation.
  2. Independent Assessments. The second core element is grounded on the evidence available. It uses fact-based independently made assessments.
  3. Final Evaluation. The third core element is undertaken when the mediating assessments are complete. The final decision is discussed only when all key attributes have been scored and a complete profile of assessments is available. However, the final evaluation may not be undertaken if a deal breaker fact has been uncovered.

Understanding the Importance of MAP

Any organization is a decision factory. Many decisions made can shape the future of organizations. At the same time, many decisions have caused organizations to fail. Decisions, unlike physical products, cannot be quality checked. However, it can be improved by working on processes by which they are made.

Mediating Assessments Protocol (MAP) is an approach that can bring quality assurance to complex decisions. One of its strategic application is in structuring one-off decisions.

Structuring one-off strategic decisions is a type of strategic decision that makes use of explicit assessment as a basis for the decision. It requires leaders to make separate, explicit assessments of each aspect.

The use of MAP in structuring one-off decisions can limit the risk that a compelling narrative will sway board discussions and affect quality decisions.  When there is a rigor of formal structure in strategic decision making, it has the benefit of sequencing the process resulting in more quality decisions.

The use of MAP requires very trivial extra effort yet it can bring a lot of benefits. Board discussions are more organized and focus than the usual process, but is not necessarily longer or more contentious. Important facts are less likely to be overlooked and thoughtful, self-critical consideration of trade-offs is more likely to occur.

Most importantly, the use of the MAP can lead to producing strategic outcomes when used in structuring recurring decisions.

Interested in gaining more understanding of Strategic Decision Making? You can learn more and download an editable PowerPoint about Strategic Decision Making here on the Flevy documents marketplace.

Are you a management consultant?

You can download this and hundreds of other consulting frameworks and consulting training guides from the FlevyPro library.

10 Best Practices in Business Dashboard Design

21 Mar

Business dashboards are important tools to measure key performance indicators and data pertaining to an organization or certain procedure.  Just as a vehicle dashboard is powerful performance management tool in summarizing a performance of a multitude of processes, a business dashboard summarizes the performance or impact of a host of functions, teams, and activities; and assists in strategic planning and decision making.

Business dashboards simplify sharing and analysis of large data, and help users visualize complex performance data in simple yet visually aesthetic manner.  Dashboards aid in simplifying complex processes into smaller more manageable information pieces for the organizational leadership to focus on everyday operations.  They keep everyone on the same wavelength and prioritize display of facts based on their importance and potential impact.  The information on a well-designed dashboard is clear, presentable to enhance meaning, readily accessible, and dynamic.  A carefully-planned dashboard allows the leadership to identify and answer business challenges in real-time, develop plan of action based on insights, and inculcate innovation.

Proficient and capable dashboard designers and firms have taken the art of visualization of valuable indicators and insights through dashboards to the next level.  They have devised specific guiding principles, dos and don’ts, and time-tested development routines to accomplish this.  These guiding principles comprise 10 best practices, which can be segregated into 3 major implementation categories:

  1. Planning
  • Analyze your audience
  • Contemplate display options
  • Prompt application loading time
  1. Design
  • Exploit eye-scanning patterns
  • Restrict number of views & colors
  • Let viewers filter data
  • Ensure proper formatting 
  1. Refinement
  • Use Tooltips to reinforce story
  • Eliminate redundancy  
  • Review the dashboard carefully

Let’s discuss the first 5 best practices for now.

Analyze your audience

A careful analysis and understanding of the business dashboard’s intended audience is the first important principle to consider before commencing the development of such a dashboard.  For instance, a busy salesperson in need of quickly going through indicators, whereas senior management needing a deep-down review of quarterly sales results.  This gives the developers a thorough idea of what the audience wants from a dashboard, what data they will visualize utilizing this, and let them know the audience’s technical capabilities in terms of data analysis, theme, issue, and business understanding.

Contemplate display options

The second principle to follow in designing a business dashboard is to research your users’ device and display preferences beforehand.  Building a dashboard with desktop display options in mind when your audience prefers to use phones to view it could be a disaster.  The designers should set the size of the dashboard properly—allowing the users to view it on a range of devices, by building in automatic sizing option for the dashboard to adopt to the dimensions of the browser window.

Prompt application loading time

Your audience and viewers are busy people who hate long waits.  Therefore a stunningly designed dashboard would not get the right traction if it takes too much time to load.  The dashboard author should facilitate prompt dashboard loading by deciding which filters to add in the dashboard and which ones to exclude.  For instance, although filtering is useful in restricting the amount of data analyzed, it effects query performance.  Some filters are quite slower than others as they load all of the data for a dimension instead of just what you want to keep.  Knowing the Order of Operations is also beneficial in reducing the load times.

Exploit eye-scanning patterns

The dashboard authors should have a deep sense of the main purpose of the dashboard in mind when develop such a tool.  They need to be aware of individuals’ eye tracking patterns—typically when most people look at a screen or content, they start scanning the upper left hand corner of the screen first by intuition—and make the best use of the screen space to display the most important content at the right place.

Restrict number of views & colors

The designers often get over enthusiastic during their application designs and try to stuff the dashboard with multiple relevant views.  This is detrimental for the bigger picture.  They must include not more than 2 to 3 views per dashboard and create more dashboards in case the scope creeps beyond the 2-3 views range.  It is also crucial to ensure the content to be clearly visible to the viewer and to use colors correctly to facilitate analysis instead of cramming too many colors in the visuals, which creates a graphical overload for the viewers, slacken analysis (or may even prevent users to analyze data), and even blur the graphics.

Let viewers filter data

Allowing users to filter the data is another best practice to keep in mind while designing business dashboards.  This added interactivity encourages data assessment and permits the users to have their most important view act as a filter for the other views in the dashboard.  This helps in conducting side-by-side analysis, promotes involvement, and retains users’ interest.

Interested in learning more about the other best practices to aid in designing a robust business dashboard and knowing the most common mistakes to avoid in this process?  You can download an editable PowerPoint on Business Dashboard Design here on the Flevy documents marketplace.

Are you a Management Consultant?

You can download this and hundreds of other consulting frameworks and consulting training guides from the FlevyPro library.

When Physical Office Becomes Passe, Are We Ready for Virtual Teams?

20 Mar

Richard Branson, British business and philanthropist once said: “One day, offices will be a thing of the past.”

While organizations still need to travel to reach their physical offices, the rapid changes in the world are requiring businesses to form Virtual Teams. A Virtual Team refers to a group of individuals who work together from different geographic locations and rely on communication technology such as email, voice conferencing services, fax, etc.

Virtual Teams work well for an organization and is effective even from a communication perspective. In fact, it is known to complement well the Lean Management approach used by organizations. Studies from previous years have shown that well-managed, widely spread, Virtual Teams have been outperforming those that share office space. In fact, it has shown that using Virtual Teams can improve employee productivity by 45%.

In today’s highly competitive global economy, to be able to work smarter, organizations must be able to leverage the manifold benefits of a remote workforce. Likewise, organizations must also be able to manage challenges that come with working with Virtual Teams.

The 4 Core Challenges of Going Virtual

More organizations are opting to work with virtual teams. Virtual teams may have their benefits but it also has its challenges. Being able to manage these challenges will enable organizations to seize the benefits of remote workers.


There are 4 core challenges that organizations face when working with Virtual Teams. Let us take a look at the 2 core challenges.

  1. Virtual Communication. Having different time zones can be a challenge. This can lead to layers of complexity to the logistics of everyday communication. When time zones do not match, it can lead to less and less information being transmitted and can cause miscommunication. When working in a different time zone, there is a tendency to exchange information using email or instant messaging. But these may not be enough as it cannot convey as much meaning compared to vocal tone, facial expression, and physical gestures.
  2. Virtual Project Management. When working with virtual teams, the business must have a proper system and people in place. Virtual Project Management may cause some confusion and even delays. While digital tools are in place to facilitate remote project management and collaboration, it can be difficult at times to tell what each person is contributing. In fact, organizations need to put up a system to track whether the members of the virtual team are doing their required tasks.

In this digital era, Virtual Teams are becoming the new face of business operation and aligning itself with Digital Transformation. This is a global reality that businesses must accept. However, working with Virtual Teams brings a lot of challenges not only in Project Management and Virtual Communication but also in Talent Development and Technology Support. Talent Development and Technology Support are two other core challenges that can make an impact on the Virtual Team. How it is managed will define the success of your Virtual Team.

In hindsight, Virtual Teams can also bring so many benefits. Hence, it is not surprising that despite the challenges, a lot of businesses still prefer to work with Virtual Teams.

One core benefit is increased access to top talent. The world has become a global market for expertise and talents. Businesses can extend their reach to other countries in their search for needed expertise. In fact, working with virtual teams will open opportunities for businesses to work with experts in various fields with various experiences. Being able to employ the best and the brightest is more than enough for businesses to continue working with Virtual Teams and conquering challenges. Businesses just need to have appropriate support programs to give Virtual Teams a home-field advantage.

Interested in gaining more understanding of  the challenges & benefits of Virtual Teams? You can learn more and download an editable PowerPoint about Virtual Teams: Challenges & Benefits here on the Flevy documents marketplace.

Are you a management consultant?

You can download this and hundreds of other consulting frameworks and consulting training guides from the FlevyPro library.

Key Performance Indicators (KPIs) Best Practices: Your Guide to Driving Performance Improvements

18 Mar

More sophisticated managers explicitly use Key Performance Indicators (KPIs) to promote cross-functional–not just vertical–alignment. For them, KPIs are the means and methods for rigorously defining and measuring the fundamentals that matter.

Why are KPIs important? If used effectively, KPIs can clearly track value creation and deliver value for its stakeholders – customers, employees, and investors.

KPIs are being used by organizations in different ways. Yet, there are clear and measurable differences that exist in terms of how it is being used. There are organizations that use KPIs to monitor and assess performance while there are those that use KPIs to guide and drive performance improvements. Data-driven and customer-oriented leaders use KPIs in practicing Customer-centric Design, while those more concerned with hitting their numbers remain focused on efficiencies.

There are 4 primary best practices for Key Performance Indicators that organizations should follow. These best practices are every organization’s guide to using KPIs to drive performance improvements.

The 4 KPIs Best Practices

The 4 KPI Best Practices can demonstrate the effective use of KPIs to reflect and illuminate the strategic priority of organizations.

  1. Focus on Customer Experience (CX). The first KPI Best Practice, Focus on Customer Experience is focused on an increased understanding of customers’ wants and needs. There is a renewed emphasis on learning more about users of products. The main objective of focusing on customer experience is turning customers into brand advocates and evangelists. When KPIs are focused on customers beyond the sales funnel, this encourages an organization to realign itself around sharing, coordination, and collaboration.
  2. Identify Top KPIs. When top KPIs are identified, it is basically identifying the priority KPIs. Doing this requires identifying the appropriate number of KPIs to prioritize. There are guide questions than can help organizations in the prioritization of the KPIs. One of the questions can be “Is there a consensus on how KPIs affirm and support strategy? Another significant question can be one that points to how directly the functional KPIs contribute to enterprise success. When going through this process, it is important that leaders understand how KPIs interrelate and align.
  3. Foster Enterprise-wide Discussion of KPIs. A very critical Best Practice, the third KPI Best Practice is focused on reinforcing the company’s culture. In fostering enterprise-wide discussion of KPIs, KPIs must be central to leadership conversations around driving organizational behavior and change. It is not merely an assessment tool. If KPIs are not front and center at a management meeting, there is something wrong with the meeting, the management, or the KPIs.
  4. Treat KPIs as Special Class Data. Treat KPIs as Special Class Data is the fourth KPI Best practice that is essential in process transformation and automation. Organizations must understand that data and analytics are the raw ingredients of KPIs. KPIs special class as a data asset will become even more important as they become an input to ML algorithm and process automation. In the years to come, organizations can expect that data capability that supports more complex KPIs will become a source of competitive advantage.

What Matters Most

It is very clear that KPIs play a vital role in directing the priorities of organizations. With the changing global economy, organizations have been recognizing the importance of Customer Focus. In fact, it has taken a priority seat and identified as the top KPI by executives.

But does this hold true to all organizations? Identifying top KPIs is important but organizations must know the right way to identify the appropriate number of KPIs and prioritize them. It is important to note that KPIs must align well with the organization’s internal processes with its external customer behaviors.

Customer Focus is a priority, but is it also your priority KPI?

Interested in gaining more understanding of the KPI best practices? You can learn more and download an editable PowerPoint about Key Performance Indicators (KPIs) Best Practices here on the Flevy documents marketplace.

Are you a management consultant?

You can download this and hundreds of other consulting frameworks and consulting training guides from the FlevyPro library.

The 3 Effective Tests of Assessing Human Dynamics of the Board

16 Mar

Many Boards have improved their structures and processes. Yet, despite all the corporate-governance reforms undertaken, many Boards failed the test of the financial crisis. This shows that even if the Board of Directors is stacked with high qualified members and best practices, these are not enough.

Human Dynamics has come to fore in today’s highly volatile business environment. Without the right Human Dynamics, there will be a little constructive challenge between independent Directors and Management, no matter how good the Board’s processes are.

Without Human Dynamics, the Board’s contribution to the company’s fortune is likely to fall short of what it could and should. This is also a concern for executives who are not Directors but report to the Board. Without Human Dynamics, it makes it difficult for them to develop healthy and productive relationships with their Boards. This can have a dire effect on Strategy Development or when organizations are undergoing Business Transformation.

The Importance of Human Dynamics

Human Dynamics is an organizational state where collaborative CEO and Directors think like owners and guard their authority. Without the right Human Dynamics, there will be a little constructive challenge between independent Directors and Management.

Why is Human Dynamics important? When there is a lack of Human Dynamics between CEO and Directors, this can lead to an ineffective performance in the Boardroom. Board’s contribution to the company’s fortunes will fall short of what it could and should be. Non-director executives will have difficulty developing a healthy and productive relationship with the Board. Most importantly, aspiring Directors will be unable to learn what it means to be a good corporate Director.

This can be detrimental to the organization and can direly affect its competitive advantage. However, achieving the right Human Dynamics is not easy. Understanding and identifying the contours of such a fluid interpersonal exchange can be a challenge to both the Board and the CEO.

The 3 Tests in Assessing the Board’s Human Dynamics

While it may be a challenge, building the right Human Dynamics between the CEO and the Directors is essential.  There are 3 Tests executives can use to guide them in assessing the Board’s Human Dynamics.

  1. Board Ownership Mindset. Currently, outside Directors continue to be passive participants. They do not challenge Management beyond asking a few questions during Board meetings. This test is focused on building Boards to be vital stewards of the organization.
  2. CEO Collaborative Mindset. CEOs nowadays are failing to inform or involve the Board on critical developments such as merger discussions. As a result, there can be a breach of trust which can cost the CEOs their job. The second test ensures that a collaborative CEO is in place.
  3. Board Authority & Independence. The third test is focused on enabling the Board to protect its stand and independence. This is necessary when the authority of the Board is being chipped away as the CEO experiences greater success. There is also less robust questioning of Management’s proposal or worst, the readiness of the Board to agree to unreasonable demands on executive remuneration.

The 3 Tests for Boards is an effective guiding principle in developing the right Human Dynamics between the Board and the CEO. When it comes to well-functioning Boards, best practice structures are not enough. It is essential that the right Human Dynamics exists as it can help the Board and Management to fulfill their potential.

Interested in gaining more understanding of Board Excellence through Human Dynamics? You can learn more and download an editable PowerPoint about Board Excellence: Human Dynamics here on the Flevy documents marketplace.

Are you a management consultant?

You can download this and hundreds of other consulting frameworks and consulting training guides from the FlevyPro library.

| TheManWhoSoldtheWeb.com

I'll send you an email when there's exclusive or important news. Subscribe below.

© Copyright 2011-2025.   TheManWhoSoldtheWeb.com