Check out my first LIVE CASE STUDY and watch me build a 300,000+ page site! I show everything – domain, Google analytics, SEO strategy...

The Man Who Sold the Web Blog | Tag Archive | Performance Management


Tag Archives: Performance Management

How to Achieve Board Excellence? Have A High Impact, Strategic Board

7 Mar

The pressure on Boards and Directors to raise their game has remained acute. A survey of more than 770 directors from public and private companies across the industries around the world suggested that some are responding more energetically than others.

There is a dramatic difference between how directors allocate their time among boardroom activities and the effectiveness of the Boards. One in four directors assessed their impact as moderate or lower, while others reported as having a high impact across Board functions.

Today, the call to become more forward-looking and achieving Board Excellence is further highlighted. This is further emphasized when the Board and Management are pressured to find the best answers to global business concerns and issues. In Strategy Development, this becomes invaluable. It does not only lead to clearer strategies but also the creation of alignment essential in making bolder moves.

While these are essential, there is a need to raise the quality of engagement on strategy between the Board and Management for each group to achieve smarter options. This is possible only if organizations have high impact, strategic Boards in place.

High impact, strategic Boards have a greater impact as they move beyond the basics and face increasing challenges.

The Challenges that Today’s Board Face

Business is fast-changing and rapidly transforming. The global economy is increasingly pushing businesses, as well as the Board to face a gamut of challenges.

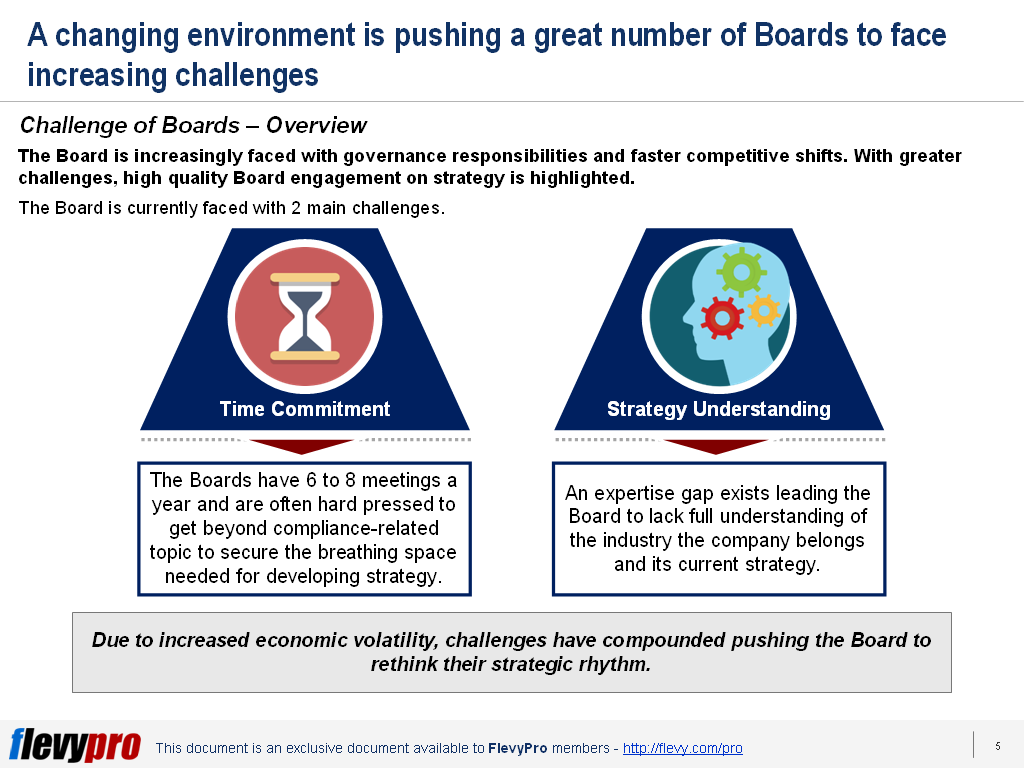
What are the 2 main challenges facing Boards today?

First is Time Commitment. Working at a high level takes discipline – and time. In fact, the greater time commitment is expected on high impact activities. The Board often have 6 to 8 meetings a year. As a result, they are often hard-pressed to get beyond the compliance-related topics to secure the breathing space needed for developing a strategy.

Often, it is the very high impact Directors who invest more time compared to moderate or lower average Directors.

Who are your very high impact Directors? They are those spend a total of 40 days a year working for the Board compared to 19 days of low impact Directors. An extra 8 workdays a year is invested in strategy and an extra 3 workdays a year are spent on Performance Management, M&A, Organizational Health, and Risk Management.

High impact Directors who believe that their activities have greater impact spend significantly more time on these activities compared to low impact Boards.

Second is Strategy Understanding. Why is Strategy Understanding a challenge for the Board? Limited understanding of the organization’s strategy can result in the Board’s limited engagement with the organization. Based on the survey made, only 21% of the Directors have a complete understanding of the current strategy. Often, Board members have a better understanding of the company’s financial position rather than its risks or industry dynamics.

If we look at high impact Directors, they invest more time in dealing with strategic issues. In fact, they invest 8 extra workdays a year on Strategic Planning and discussing strategy compared to low impact Directors. High impact Directors center on Strategy Focus Areas which can, in turn, spur high-quality engagement from the Board on strategy development. The quality of Board engagement on strategy is enhanced, both when the engagement is deep and during the regular course of business.

The Board just needs to focus on 3 areas of discussion for the Board to enhance Strategy Development. One of them is Industry and Competitive Dynamics.

Interested in gaining more understanding of Board Excellence via High Impact, Strategic Boards? You can learn more and download an editable PowerPoint about Board Excellence: High Impact, Strategic Boards here on the Flevy documents marketplace.

Are you a management consultant?

You can download this and hundreds of other consulting frameworks and consulting training guides from the FlevyPro library.

Strategic Key Performance Indicators (KPIs) Primer: Introduction to The KPI Virtuous Cycle

26 Jan

Technological innovation and intensifying competition are forcing leaders to rethink how they use Key Performance Indicators (KPIs) to manage and direct organizations.  Digitization has reinforced the importance of Key Performance Indicators not only in enhancing employee performance but driving the overall organizational productivity.

The role of KPIs is becoming more dynamic.  KPIs are getting demonstrably flexible, smarter, and valuable in achieving strategic advantage.  Leading technology-driven organizations—including Amazon, Airbnb, and Uber—rely on metrics considerably and utilize KPIs to steer their strategy and evaluate success.  They perceive KPIs quite differently than traditional-focused organizations, and employ them as an input for automation, and to guide, regulate, and improve their machine learning tools.

To make the most out of these dynamic and strategic KPIs of this Digital Age, leaders need to be more insightful and knowledgeable.  They should be able to thoroughly determine which KPIs to analyze, how to measure them, and how to effectively improve them.  Understanding the value of selected KPIs and their optimization is key to aligning strategies; making the right decision to invest in data, analytics, and automation capabilities; and create a link between people and machines.

KPI Virtuous Cycle

The relationships and dependencies that clarify, educate, and enhance KPI investment are demonstrated by “KPI Virtuous Cycle.”  By digitally linking KPIs, data, and decision-making into virtuous cycles, companies can align their immediate situational requirements with long-term strategic planning.  The KPI Virtuous Cycle has 3 key components, and it demands active cross-functional collaboration:

  1. Data Governance
  2. KPIs
  3. Decision Rights

The way these 3 components impact—and support each other—keeps changing.  Organizations aspiring to become digital-savvy should embrace, value, and relentlessly invest in the KPI Virtuous Cycle.

Data Governance

The first component of the KPI Virtuous Cycle is about employing authority and control (planning, monitoring, and enforcement) through a set of practices and processes to manage organizational data assets.  Leading digital organizations consider data as a strategic resource, a valuable tool for measurement and accountability, and a mechanism to facilitate meeting strategic KPIs.  Data Governance frameworks are guided by strategic KPIs.  Organizations should know what data sets would be ideal to predict and rank—for instance, customers’ lifetime value and their propensity to leave—to prioritize preemptive and preventive action.  Data and Analytics serve as a component of Data Governance.

Strategic KPIs

Strategic KPIs shape and govern enterprise Data Governance models.  These KPIs include financial, customer, supplier, channel, and partner performance parameters.  For instance, Data Governance initiatives in customer-centric organizations are prioritized to facilitate in realizing customer-focused KPIs—e.g., Net Promoter Score (NPS) and Customer Lifetime Value (CLV).  Enterprise Data Governance frameworks are strongly influenced and informed by strategic KPIs.

Decision Rights

Decision Rights ascertain the decision-making authority required to drive the business and strategic alignment.  Making decisions in such a way that it boosts organizational performance involves identifying the individuals explicitly involved in making decisions, charting an outline on how decisions will be made, reinforcing with appropriate processes and tools, and defining various decision rights scenarios to facilitate in automation.  It is, however, quite tricky to determine and assign decision rights when an enterprise is aspiring to empower its people and making machines function better.

Imperatives for Creating Dynamic and Strategic KPIs

For the KPIs to be strategically defined and become truly dynamic, the leadership needs to provide the required support by getting thorough data sets compiled and meaningful analytics performed.  At the same time, there is a need to:

  • Decide whether the decision rights needs to be assigned to individuals (rather than machines or vice versa.
  • Enhance the capabilities of people and machines.
  • Apply decision rights to generate data to identify and gauge productivity.
  • Identify the delays and bottlenecks between KPIs, data, and decisions.
  • Verify the diligence in the way KPIs, data, and decisions are mapped and monitored.

Interested in learning more about the components of KPI Virtuous Cycle, its applications, and Strategic KPIs?  You can download an editable PowerPoint on Strategic Key Performance Indicators (KPIs) here on the Flevy documents marketplace.

Are you a Management Consultant?

You can download this and hundreds of other consulting frameworks and consulting training guides from the FlevyPro library.

What Areas to Focus On While Devising Key Performance Indicators (KPIs)?

25 Jan

Creating a culture that measures productivity objectively is a sensitive matter.  Key Performance Indicators (KPIs) are being employed extensively by organizations across the globe to monitor and track performance.  KPIs provide valuable metadata to improve top-down and bottom-up vertical efficiency.

Analytics-driven firms are aware that KPIs are much more than a tool to evaluate performance.  Utilizing KPIs, they gather valuable insights, create enterprise-wide accountability, and develop a goal-oriented culture.

However, most executives typically fall short of utilizing KPIs to their full potential.  They have to realize that the effectiveness of KPIs depends on two distinct yet important elements: KPI transparency for the entire workforce—making the core metrics available across the board at all levels—and alignment of KPIs—determining the KPIs most relevant to the people and organizational purpose, and taking action based on the results of performance monitoring.  Leading organizations share KPIs with all stakeholders and use algorithms to gauge the contribution of KPIs to critical functions, e.g., Marketing and Customer Experience.

To create an objective-driven culture, the senior leadership should work on developing capabilities to outline key performance and putting in place accurate metrics to measure it.  The selection and prioritization of most relevant indicators is something that the leadership needs to carefully think about.

When defining KPIs, there are 5 KPI focus areas.  Each focus area is unique and critical, but collectively they have a profound impact on each other and on the organizations that are aiming to undergo Digital Transformation.  Leading Data and Analytics-driven organizations devise KPIs that cover all 5 of these focus areas:

  1. Enterprise KPIs
  2. Customer KPIs
  3. Workplace Analytics
  4. Partner and Supplier KPIs
  5. Quantified-self KPIs

Let’s discuss the first 3 focus areas in detail, for now.

Enterprise KPIs

The Enterprise KPIs benchmark the effectiveness of core functions of an organization.  These indicators are important to determine the accountability of the leadership and workforce, and are vital for strategic as well as routine decision-making and investment.  Examples of these indicators include Risk-Adjusted Return On Capital (RAROC) and Net Promoter Score (NPS).

Customer KPIs

The Customer KPIs facilitate in measuring the knowledge and impact of all leads, prospects, and customers. These metrics are used to calculate the actual and likely financial contributions of business prospects and clients.  The Customer KPIs assist in analyzing and ranking the relationships that organizations aspire to develop with the customers and better understanding each segment and sales funnel the customers belong.  Customer lifetime value is an example of these indicators.

Workplace Analytics

The Workplace Analytics pertain to quantifying the efficiency and commitment level of organizational people.  These analytics are used to isolate leadership tools and methodologies helpful in enhancing customer focus, and capture and quantify process outcomes and outputs feeding organizational KPIs.  These metrics are valuable in measuring collaboration across the organization, gauging the proficiency of managers in motivating their teams, and highlighting the elements that demoralize people.

Interested in learning more about the 5 KPI areas of focus?  You can download an editable PowerPoint on Key Performance Indicators (KPIs): 5 Areas of Focus here on the Flevy documents marketplace.

Are you a Management Consultant?

You can download this and hundreds of other consulting frameworks and consulting training guides from the FlevyPro library.

Traditional Value-Based Management vs. Value Creation through Relative Shareholder Return

22 Oct

Value-Based Management (VBM) has been regarded traditionally as a tool to help investors evaluate firms, optimize performance management, and maximize shareholder value.

However, there are mixed opinions on whether to utilize VBM as a mandatory investment or management tool. Many investors, analysts, and executives, to this day, are skeptical of the influence and role of VBM in confronting the dot-com bubble or other financial downturns. They are even cynical of the efficacy of VBM as a robust management approach for the future or its effectiveness in creating competitive advantage for them.

The following are some shortcomings associated with the traditional VBM approaches that leaders should negotiate:

  • An inadequate link between VBM practices and capital markets realities — absence or lack of analysis of the capital markets to expose gaps between a company’s intrinsic value and actual stock price.
  • Aligning VBM with the organizational systems and its culture for value creation.
  • A broken process for managing the controls that govern value creation — traditional VBM offers rich insights on managing economic principles, but lacks a process on how to further align strategic, cultural, and behavioral levers.

Value Creation Framework

The lack of trust in the effectiveness of VBM necessitates formulating a more thorough, fact-based approach to executing VBM. In developing a value creation agenda, it is quite uncomplicated to conceptually convince managers and employees that it is their main shared focus, but the core challenge is to devise a practical and integrated implementation approach.

The Value Creation Framework depends on 4 value creation levers that senior management can pull in order to effectively achieve their value creation goal. These levers are not autonomous and need to be activated in tandem:

  • Operational Effectiveness
  • Competitive Strategy
  • Portfolio Management
  • Investor Strategy

The framework first stresses the management team to agree on the shared aspirations, prioritized levers, and how the headquarters activities are to be aligned with the business units. This entails revisiting the assumptions, priorities, decisions, tools, and culture at all levels across an organization to harness VBM to achieve improved value creation. The framework warrants the VBM approach to be embraced as a culture to maximize value creation — which is measured in Relative Total Shareholder Return.

Relative Total Shareholder Return (RTSR)

Focusing and aligning the organizations around a shared mission is important for the leadership. Clearly laid out, compelling vision and aspirations — that are reinforced daily — have a profound positive impact on an organization’s value creation potential.

Value creation best practices necessitate establishing a single, long-term goal — the Relative Total Shareholder Return (RTSR) performance. The Relative Total Shareholder Return reflects a firm’s capital gains plus dividend yield relative to a peer group or market index.

The RTSR concept is not new, but practically most companies find it hard to implement RTSR as a goal-setting tool. The RTSR should be clearly quantified and communicated across the board as a long-term goal. The RTSR aspirations motivate and empower line management to work as entrepreneurs to achieve it, set objective targets, and connect business unit management to capital markets discipline. If done right, RTSR is a useful method to specify and communicate a firm’s objectives and the supporting execution plans.

Measuring RTSR Objective

Measuring the RTSR goal achievement at the corporate level can be done by ranking a firm’s TSR against its peers TSR. A RTSR target can be set to analyze the effect of corporate and business unit plans. This can be done by quantifying a subjective goal — e.g., top half or top quartile TSR — into a specific number. The calculations warrant developing a forward-looking RTSR target on the following 3 footings:

  • Anticipated 5-year company cost of equity — to gather an investor’s view of the risk-adjusted average expected return that a firm or market index is priced to deliver.
  • Anticipated spread to achieve relative TSR goal — calculating stretched, above-average TSR goal needs personal discretion. It can be done through superior performance improvements instead of maintaining superior absolute levels of performance.
  • Forward looking 5-year RTSR target — calculation of this goal requires 2 key considerations: RTSR probability of reaching above-median TSR and benchmarks to meet a cumulative top quartile TSR target over different time periods.

Interested in learning more about the Value Creation Framework? You can download an editable PowerPoint on Value Creation: Relative Total Shareholder Return here on the Flevy documents marketplace.

Are you a Management Consultant?

You can download this and hundreds of other consulting frameworks and consulting training guides from the FlevyPro library.

How to Secure the Promised Revenue Synergies After Signing a Merger Deal?

15 Oct

Stiff market competition, expansion into new territories, product portfolio extension, and gaining new capabilities are the prime reasons why more and more organizations are seriously looking into the prospects of — and carrying out — Mergers and Acquisitions. However, only a few M&As achieve their desired revenue objectives.

Revenue Synergies are a decisive factor in closing such deals. However, identifying precisely where these Revenue Synergies lie and then capturing them isn’t as easy as it sounds.

McKinsey study comprising of 200 M&A executives from 10 different sectors revealed that all the respective organizations of the respondents remained short of achieving their Revenue Synergy targets (~23% short of the target on average). Securing Revenue Synergies is a long-term game. The companies that succeed in securing Revenue Synergies achieve the target in or around 5 years.

Leaders aspiring to achieve Revenue Synergies should first clarify the objectives from and the schedule of the revenue synergies, lay out the organizational priorities and go-to-market strategies, remove obstacles from realizing value, and gain across the board readiness and commitment for the initiative. Organizations that are most successful in securing revenue synergies pay close attention to these 7 guiding principles during the Post-merger Integration process:

  1. Source of Synergies
  2. Leadership Ownership
  3. Customer Insight-driven Opportunities
  4. Salesperson Driven Strategy
  5. Ambitious Targets and Incentives
  6. Sufficient Support
  7. Performance Management

These 7 guiding principles to capturing Revenue Synergies are critical for effective integration of two firms after a merger and unlocking potential benefits from the deal. Let’s discuss the first 3 principles in detail now.

1. Source of Synergies

The inability of the leadership of the acquiring company to spot major sources of revenue that integration brings in results in losing significant pools of opportunity and failure of M&As. Realizing Revenue Synergies demands a thorough methodology to ascertain and qualify revenue prospects along markets and channels, Go-to-Market Strategies, and developing commercial capabilities. This entails:

  • Evaluating customers and markets, selling offerings of the combined firms utilizing existing and additional channels, and adequately training and rewarding the sales teams.
  • Coming up with innovative new products and bundles utilizing combined R&D capabilities.
  • Sharing best practices and commercial capabilities that mergers offer.

2. Leadership Ownership

Organizations that accomplish their Revenue Synergy objectives guarantee that their top management and employees commit themselves fully to the initiative from the onset. They identify potential value pockets from the integration, examine the assumptions about securing value, and get them endorsed by the senior management and front-line staff. The potential Revenue Strategies are regularly evaluated by inter-departmental experts.

3. Customer Insight-driven Opportunities

Accurate estimation of Revenue Synergies demands top-level estimates — assumptions on market share gain, revenue enhancement, or improved penetration — alongside comprehensive bottom-up customer insights, and evaluation of customer relationships. Other important elements to consider include analyzing the offerings being offered to customers, discerning other potential products and services required by the customers, and assessing the ability of the sales team and brands in terms of the potential they offer to the clients.

Interested in learning more about the other guiding principles of securing PMI revenue synergies? You can download an editable PowerPoint on Post-merger Integration (PMI): Securing Revenue Synergies here on the Flevy documents marketplace.

Are you a Management Consultant?

You can download this and hundreds of other consulting frameworks and consulting training guides from the FlevyPro library.

| TheManWhoSoldtheWeb.com

I'll send you an email when there's exclusive or important news. Subscribe below.

© Copyright 2011-2024.   TheManWhoSoldtheWeb.com