Check out my first LIVE CASE STUDY and watch me build a 300,000+ page site! I show everything – domain, Google analytics, SEO strategy...

The Man Who Sold the Web Blog | Tag Archive | analytics


Tag Archives: analytics

11 Pillars: Quality 4.0 Framework

17 Feb

Stock image 2 - Quality 4.0

The introduction of emerging, digital technologies has ushered in the Fourth Industrial Revolution.  To keep the competitive advantage in this era of Digital Transformation, leveraging contemporary technology is an absolute necessity.  Using cutting-edge technology means not just augmenting, but in fact, revamping the whole Quality outlook.

Quality 4.0 is the complimentary Quality approach to the Industry 4.0 era. Quality 4.0 is about transforming and improving Organizational Culture, collaboration, competency, and Leadership Development among other things through the application of technology.

Quality 4.0 is characterized by:

  • Transforming and improving culture, collaboration, competency, and leadership through the application of technology.
  • Digital Transformation of Management Systems and compliance.
  • Enabling technology and processes necessary to maximize value, resolve customary Quality impediments, and provide innovative solutions.

Quality 4.0 is not just about Digitalization, but more importantly about the impact of that Digitalization on Quality technology, processes, and people.

Companies can use the 11 pillars of Quality 4.0 Framework to identify how the existing capabilities and initiatives can be transformed and then educate, plan, and act accordingly.  The framework uses the traditional Quality methods to build upon and improve them.  The 11 pillars of Quality 4.0 include:

  1. Data
  2. Analytics
  3. Connectivity
  4. Collaboration
  5. App Development
  6. Scalability
  7. Management Systems
  8. Compliance
  9. Culture
  10. Leadership
  11. Competency

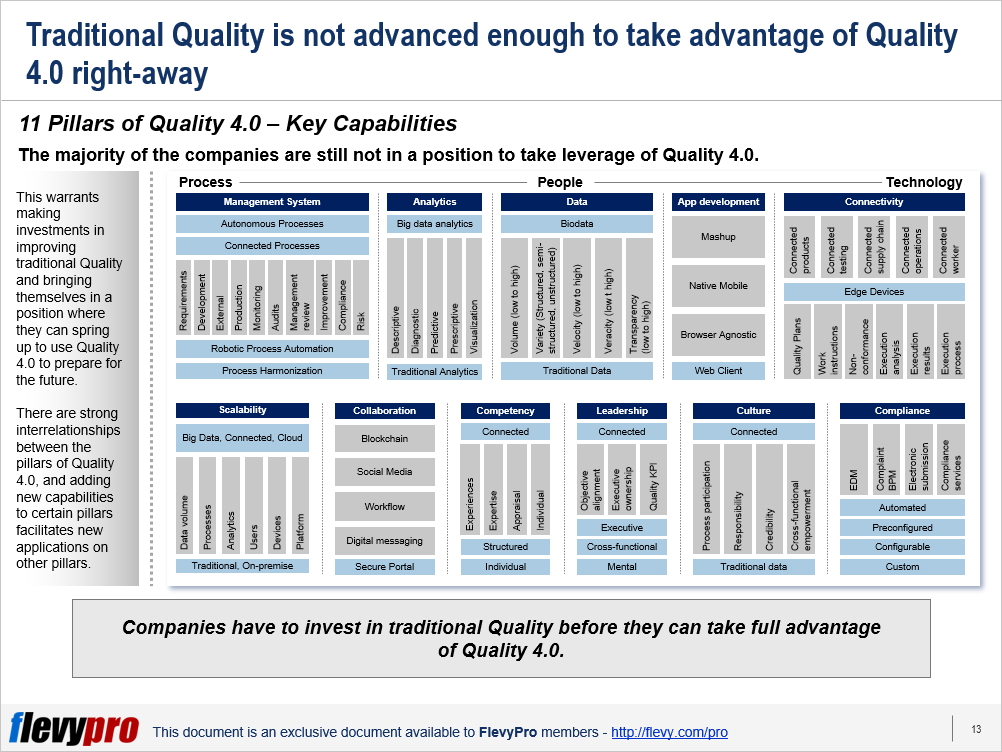
The majority of the companies are still not in a position to take leverage of Quality 4.0.  This warrants making investments in improving traditional Quality and bringing themselves in a position where they can spring up to use Quality 4.0 to prepare for the future.

There are strong interrelationships between the pillars of Quality 4.0, and adding new capabilities to certain pillars facilitates new applications on other pillars.  Let us delve a little deeper into a few of these pillars.

1. Data and 2. Analytics

Data and Analytics form the first 2 pillars.  Data is key to informed decision making.  Most companies are still using fragmented data while the innovating market leaders have progressed to taking leverage of Big Data.  Data can be better understood by understanding its 5 components:  Volume, Variety, Velocity, Veracity, and Transparency.

Analytics help reveal the insights contained within raw data.  Correct metrics are key to uncovering correlations and patterns—meaningful information.  Big Data Analytics using Machine Learning and Artificial Intelligence is beneficial if the Analytics Framework—comprising Descriptive, Diagnostic, Predictive, and Prescriptive Analytics—is understood clearly.

3. Connectivity

Connectivity encompasses the link between Business Information Technology—e.g., Enterprise Quality Management Systems (EQMS), Product Life-cycle Management (PLM), Enterprise Resource Planning—and Operational Technology that is used in Manufacturing, Labs, and Services.  Connectivity is achieved through abundant and inexpensive sensors providing real-time feedback from Connected People, products, edge devices, and processes.

4. Scalability

Scalability creates uniformity in Quality.  It is the ability to harmonize processes, best practices, competencies, and lessons learnt across the organization, be it global.  Cloud Computing has played a pivotal role in harnessing scalability by providing Software as a Service (SaaS), Infrastructure as a Service (IaaS), Platform as a Solution (PaaS), and connection of databases.

The reality of the future is Quality 4.0.  It is being adopted very swiftly.  Those who remain unfamiliar with it or are slow to adopt run the risk of being marginalized very quickly.

Interested in learning more about Quality 4.0? You can download an editable PowerPoint on Quality 4.0 here on the Flevy documents marketplace.

Do You Find Value in This Framework?

You can download in-depth presentations on this and hundreds of similar business frameworks from the FlevyPro Library.  FlevyPro is trusted and utilized by 1000s of management consultants and corporate executives. Here’s what some have to say:

“My FlevyPro subscription provides me with the most popular frameworks and decks in demand in today’s market. They not only augment my existing consulting and coaching offerings and delivery, but also keep me abreast of the latest trends, inspire new products and service offerings for my practice, and educate me in a fraction of the time and money of other solutions. I strongly recommend FlevyPro to any consultant serious about success.”

– Bill Branson, Founder at Strategic Business Architects

“As a niche strategic consulting firm, Flevy and FlevyPro frameworks and documents are an on-going reference to help us structure our findings and recommendations to our clients as well as improve their clarity, strength, and visual power. For us, it is an invaluable resource to increase our impact and value.”

– David Coloma, Consulting Area Manager at Cynertia Consulting

“FlevyPro has been a brilliant resource for me, as an independent growth consultant, to access a vast knowledge bank of presentations to support my work with clients. In terms of RoI, the value I received from the very first presentation I downloaded paid for my subscription many times over! The quality of the decks available allows me to punch way above my weight – it’s like having the resources of a Big 4 consultancy at your fingertips at a microscopic fraction of the overhead.”

– Roderick Cameron, Founding Partner at SGFE Ltd

10 Technologies Disrupting the Way Warehousing Operations are Managed

22 Jan

Shortage of labor, intensified demand from e-tailers (online retailers), and technological disruption is forcing organizations in the Logistics and Warehousing industry to embrace technology, particularly Automation.

An investment in automating the picking, packing, sorting, storing, and shipping items can yield high returns for organizations.  Warehouses that will sort out the dynamics of e-commerce, select the ideal technology to implement, and eliminate uncertainties in their supplier contracts will outpace others.

Automation is facilitating the Warehousing operations predominantly by:

  • Assisting the movement of goods.
  • Improving the handling of goods.

In these two categories, there are 10 technologies that are fast disrupting the Supply Chain function and creating a breakthrough for warehouses.  These include:

  1. Multi-shuttle System
  2. Optical Recognition
  3. Conveyor Connection
  4. Warehouse Management Systems
  5. Smart Storage
  6. 3D Printing
  7. Swarm AGV Robots
  8. Analytics & Algorithms
  9. Smart Glasses
  10. Picking Robots

Let’s discuss a few of these disruptive technologies in detail.

Multi-shuttle System

Multi-shuttle systems (MSS) are employed to store and retrieve goods automatically—using automated storage and retrieval system (AS/RS).  This system is able to transport goods 3 dimensionally (on pallets), and is instrumental in enhancing the throughput, flexibility and efficiency levels.

MSS consists of 3 modules, coordinated by a software module: a Shuttle car powered by power caps for 24-hour operations and moved by powerful motors, high-performance vertical lifts, and a special carrier to move the shuttle car to the exact location.  Communication in the multilevel systems’ carrier and shuttles is managed by radio links, whereas the movement is controlled by an integrated control system.

Multilevel Shuttle Storage System is ideal for cold storage, buffer storage, dispatching warehouses, commissioning warehouses, supply and distribution centers, and factories.

MSS offers a number of benefits, e.g.:

  • High item storage and retrieval velocity.
  • Optimum use of building space.
  • High storage density.
  • Ability to be retrofitted in existing warehouses.

Optical Recognition

Optical Recognition and Sensor technology expedites processes and increases productivity.  This technology is at the foundation of IoT, smart cities, automobiles and laser-guided vehicles, smartphones, wearable technologies, drones, barcode readers, and more.

Optical Recognition devices use a light source to read characters and barcodes.  They then convert these characters into digital data.  Optical Recognition devices scan items.  At times, this scanning is done on 6 axes.  The character recognition software then relates this image to the shapes of individual characters.

Optical recognition devices today use sensors to detect and respond to a specified input—light, sound, motion, pressure, temperature.  Once an input is received, a sensor either produces a resulting output—in the form of a light or alarm—or forward the information received to a network for processing.

Optical recognition sensors facilitate in:

  • Accelerating and improving processes, inspecting parts for error checking, and quality monitoring.
  • Delivering real-time data to make better decisions.
  • Handling repetitive and hazardous tasks and making workplaces safer
  • Freeing up people to manage more complex endeavors.
  • Slashing energy wastage and creating connected, smart factories.

Conveyor Connection

Connected Conveyor Systems are useful in transporting heavy or bulky materials.  These systems allow quick and efficient transport of a variety of materials (e.g. totes, cartons) in different warehouse configurations.  Advanced conveyor systems and connections perform various material handling requirements including accumulation, transportation, diverting, merging, and sorting products.

Interested in learning more about the other technologies reshaping the warehousing operations?  You can download an editable PowerPoint presentation on Warehouse Automation: 10 Technologies here on the Flevy documents marketplace.

Do You Find Value in This Framework?

You can download in-depth presentations on this and hundreds of similar business frameworks from the FlevyPro LibraryFlevyPro is trusted and utilized by 1000s of management consultants and corporate executives. Here’s what some have to say:

“My FlevyPro subscription provides me with the most popular frameworks and decks in demand in today’s market. They not only augment my existing consulting and coaching offerings and delivery, but also keep me abreast of the latest trends, inspire new products and service offerings for my practice, and educate me in a fraction of the time and money of other solutions. I strongly recommend FlevyPro to any consultant serious about success.”

– Bill Branson, Founder at Strategic Business Architects

“As a niche strategic consulting firm, Flevy and FlevyPro frameworks and documents are an on-going reference to help us structure our findings and recommendations to our clients as well as improve their clarity, strength, and visual power. For us, it is an invaluable resource to increase our impact and value.”

– David Coloma, Consulting Area Manager at Cynertia Consulting

“As a small business owner, the resource material available from FlevyPro has proven to be invaluable. The ability to search for material on demand based our project events and client requirements was great for me and proved very beneficial to my clients. Importantly, being able to easily edit and tailor the material for specific purposes helped us to make presentations, knowledge sharing, and toolkit development, which formed part of the overall program collateral. While FlevyPro contains resource material that any consultancy, project or delivery firm must have, it is an essential part of a small firm or independent consultant’s toolbox.”

– Michael Duff, Managing Director at Change Strategy (UK)

A Startling Fact about Analytics-driven Organizations

27 Mar

Enterprises invest in Analytics to improve Decision Making and outcomes across the business. This is from Product Strategy and Innovation to Supply Chain Management, Customer Experience, and Risk Management. Yet, many executives are not yet seeing the results of their Analytics initiatives and investments.

Every organization putting on investment in Analytics has experienced several stumbling blocks. This differentiates the leaders from the laggards. Analytics-driven Organizations have clearly established processes, practices, and organizational conditions to achieve Operational Excellence. Their commitment to Analytics is creating a major payoff from their investments and a competitive edge.

What It Takes to Be Analytics-driven

The Harvard Business Review Analytic Services conducted a survey of 744 business executives around the world and across a variety of industries. Their focus was on the performance gap between companies that have struggled to get a return on their Analytics investment and those that have effectively leveraged their investment.

The survey showed that Analytics-driven Organizations get sufficient return on investment in Analytics. In fact, they have been highly successful in gaining a return on Analytics investment. This is gainfully achieved as organizations use Analytics consistently in strategic decision making. Executives of Analytics-driven Organizations rely on Analytics insights when it contradicted their gut feel.

Essentially, Analytics-driven Organizations have reduced costs and risks, increased Productivity, Revenue, and Innovation, and have successfully executed their Strategy. Yet, in evolving the organization’s Analytics approach, there can be 4 core obstacles that can affect their drive to getting a greater return on investment in Analytics.

The Core Obstacles to Finding Return on Analytics Investment

There are 4 core obstacles to being an Analytics-driven Organization.

Let’s briefly take a look at the first 2 obstacles:

  1. Communication and Decision-making Integration. The lack of Communication and Decision-making Integration limits the integration of Analytics into workflows and decision processes do not reach decision-makers. As a result of these core obstacles, the use of Analytics is limited in specific areas.
  2.  Skills to Interpret and Apply Analytics. A second core obstacle is the inadequate skills of business staff to interpret and use Analytics. In fact, the survey showed that only one-quarter of frontline employees use Analytics with only 7% using Analytics regularly.

The other two core obstacles are siloed and fragmented Analytics and time delay. These are two equally important core obstacles that can hinder the use of Analytics to maximize return on investment. Further, the 4 core obstacles are barriers to analytic success.

Are You Ready to Be an Analytics Leader?

Leaders use Analytics consistently in decision making. In fact, based on the survey, 83% of executives use it in business planning and forecasting. On the other hand, laggards only use it 67% of the time. Even in various aspects of the organization such as Marketing, Operations, Strategy Development, Sales, Supply Chain, Pricing and Revenue Management, and Information Technology, laggards use Analytics only half the time compared to Analytics Leaders.

Analytics Leaders always ensure that they establish the processes and organizational conditions to allow them to successfully deploy Analytics. In fact, to increase return on Analytics, organizations must undertake the use of four interrelated initiatives that will drive greater return on investment Analytics. These are four initiatives essential to building an Analytics-driven Organization.

One is building an organizational culture around Analytics. To achieve this the organization must have clear, strategic, and operational objectives that are set for Analytics. Second is deploying Analytics throughout all core functions of the business.

Starting with an Analytics-driven Culture can greatly facilitate cross-functional deployment of Analytics.

Interested in gaining more understanding of Analytics-driven Organization? You can learn more and download an editable PowerPoint about Analytics-driven Organization here on the Flevy documents marketplace.

Are you a management consultant?

You can download this and hundreds of other consulting frameworks and consulting training guides from the FlevyPro library.

Strategic Key Performance Indicators (KPIs) Primer: Introduction to The KPI Virtuous Cycle

26 Jan

Technological innovation and intensifying competition are forcing leaders to rethink how they use Key Performance Indicators (KPIs) to manage and direct organizations.  Digitization has reinforced the importance of Key Performance Indicators not only in enhancing employee performance but driving the overall organizational productivity.

The role of KPIs is becoming more dynamic.  KPIs are getting demonstrably flexible, smarter, and valuable in achieving strategic advantage.  Leading technology-driven organizations—including Amazon, Airbnb, and Uber—rely on metrics considerably and utilize KPIs to steer their strategy and evaluate success.  They perceive KPIs quite differently than traditional-focused organizations, and employ them as an input for automation, and to guide, regulate, and improve their machine learning tools.

To make the most out of these dynamic and strategic KPIs of this Digital Age, leaders need to be more insightful and knowledgeable.  They should be able to thoroughly determine which KPIs to analyze, how to measure them, and how to effectively improve them.  Understanding the value of selected KPIs and their optimization is key to aligning strategies; making the right decision to invest in data, analytics, and automation capabilities; and create a link between people and machines.

KPI Virtuous Cycle

The relationships and dependencies that clarify, educate, and enhance KPI investment are demonstrated by “KPI Virtuous Cycle.”  By digitally linking KPIs, data, and decision-making into virtuous cycles, companies can align their immediate situational requirements with long-term strategic planning.  The KPI Virtuous Cycle has 3 key components, and it demands active cross-functional collaboration:

  1. Data Governance
  2. KPIs
  3. Decision Rights

The way these 3 components impact—and support each other—keeps changing.  Organizations aspiring to become digital-savvy should embrace, value, and relentlessly invest in the KPI Virtuous Cycle.

Data Governance

The first component of the KPI Virtuous Cycle is about employing authority and control (planning, monitoring, and enforcement) through a set of practices and processes to manage organizational data assets.  Leading digital organizations consider data as a strategic resource, a valuable tool for measurement and accountability, and a mechanism to facilitate meeting strategic KPIs.  Data Governance frameworks are guided by strategic KPIs.  Organizations should know what data sets would be ideal to predict and rank—for instance, customers’ lifetime value and their propensity to leave—to prioritize preemptive and preventive action.  Data and Analytics serve as a component of Data Governance.

Strategic KPIs

Strategic KPIs shape and govern enterprise Data Governance models.  These KPIs include financial, customer, supplier, channel, and partner performance parameters.  For instance, Data Governance initiatives in customer-centric organizations are prioritized to facilitate in realizing customer-focused KPIs—e.g., Net Promoter Score (NPS) and Customer Lifetime Value (CLV).  Enterprise Data Governance frameworks are strongly influenced and informed by strategic KPIs.

Decision Rights

Decision Rights ascertain the decision-making authority required to drive the business and strategic alignment.  Making decisions in such a way that it boosts organizational performance involves identifying the individuals explicitly involved in making decisions, charting an outline on how decisions will be made, reinforcing with appropriate processes and tools, and defining various decision rights scenarios to facilitate in automation.  It is, however, quite tricky to determine and assign decision rights when an enterprise is aspiring to empower its people and making machines function better.

Imperatives for Creating Dynamic and Strategic KPIs

For the KPIs to be strategically defined and become truly dynamic, the leadership needs to provide the required support by getting thorough data sets compiled and meaningful analytics performed.  At the same time, there is a need to:

  • Decide whether the decision rights needs to be assigned to individuals (rather than machines or vice versa.
  • Enhance the capabilities of people and machines.
  • Apply decision rights to generate data to identify and gauge productivity.
  • Identify the delays and bottlenecks between KPIs, data, and decisions.
  • Verify the diligence in the way KPIs, data, and decisions are mapped and monitored.

Interested in learning more about the components of KPI Virtuous Cycle, its applications, and Strategic KPIs?  You can download an editable PowerPoint on Strategic Key Performance Indicators (KPIs) here on the Flevy documents marketplace.

Are you a Management Consultant?

You can download this and hundreds of other consulting frameworks and consulting training guides from the FlevyPro library.

When Data is Not Enough: The Need to Understand Purpose-driven Analytics

27 Nov

The Data Analytics Revolution is here. It is transforming how companies organize, operate, manage talent, and create value. In fact, advanced data analytics is now a quintessential business matter. It is important for CEOs and top executives to be able to clearly articulate its purpose and translate it into action. Yet, this is not so.

CEOs and top executives are finding it difficult to articulate the clarity of purpose and act on it. It must not just stay in an Analytics department but must be embedded throughout the organization where the insights will be used. Leaders with strong intuition do not just become better equipped to kick the tires on their analytics efforts. They can capably address the many critical top management challenges by employing a range of tools, employing the right personnel, applying hard metrics, and asking hard questions.

Data Analytics is a means to an end. It is a discriminating tool for identifying and implementing a value-driving answer. It can unleash insights that could be the very core of your organization’s approach to improving performance. This, however, cannot be achieved if there is no clarity in the purpose of your data.

Data Analytics Revolution: Are We Ready?

The Data Analytics Revolution is transforming how companies organize, operate, manage talents, and create value. But are we ready for this? A number of companies are reaping major rewards from Data Analytics. But this is far from the norm. More CEOs and top executives are avoiding getting dragged into the esoteric weeds.

Data Analytics have complex methodologies and there is a sheer scale of data sets. Machine Learning is becoming increasingly more important. For us to be ready in the onset of Data Analytics Revolutions, we need to be capable of addressing many critical and complimentary top management challenges. We need to be able to ground even the highest analytical aspirations in traditional business principles and deploy a range of tools and people.

To be properly equipped on the proper use of Data Analytics, we just need to develop a mindset for Purpose-driven Analytics anchored on 4 guiding principles.

The 4 Guiding Principles of Purpose-driven Analytics

  1. Ask Clear and Correct Questions. The first principle focuses on generating impact the soonest. Hence, precise questions are asked based on the company’s best-informed priorities. Here, clarity is essential.
  2.  Identify Small Changes for Big Impact. The second principle focuses on generating gains even on small improvements. There is a need to identify small points of difference to amplify and exploit because the smallest edge can make the biggest difference.
  3. Leverage Soft Data. The third principle focuses on getting quality insights and generating sharper conclusions. It is at this point wherein the use of softer inputs such as industry forecasts, predictions from product experts, and social media commentary are given more emphasis. Soft data is essential when trying to connect the dots between more exact inputs.
  4. Connect Separate Data Sets. The fourth principle focuses on capturing the untapped value. This principle emphasizes the need to combine sources of information to make sharper insights. When different data sets are examined, the greater is the probability that problems can easily be fixed.

From Learning to Doing: Connecting the Dots

It is not enough that organizations learn about Purpose-driven Analytics. One also needs to be able to put these into effective use. Companies must take a multi-faceted approach to analyze data to minimize overwhelming complexity. There are 4 guiding principles for Purpose-driven Analytics implementation. Using these principles will facilitate the effective use of analytics and transform outputs into action.

Interested in gaining more understanding of Purpose-driven Analytics? You can learn more and download an editable PowerPoint about Purpose-driven Analytics here on the Flevy documents marketplace.

Are you a management consultant?

You can download this and hundreds of other consulting frameworks and consulting training guides from the FlevyPro library.


| TheManWhoSoldtheWeb.com

I'll send you an email when there's exclusive or important news. Subscribe below.

© Copyright 2011-2024.   TheManWhoSoldtheWeb.com